 how-to
How to Reduce Print Waste in Supply Chain
Table of Contents
- Establish a Waste Baseline and Measurement System
- Improve Print Inventory Management Across Locations
- Optimize Production Planning and Job Efficiency
- Adopt Print-on-Demand for Businesses to Lower Overproduction
- Implement Sustainable Printing Practices in Your Supply Chain
- Execute Quality Inspection and Defect Prevention
- Create a Closed-Loop Recycling Program
- Frequently Asked Questions
Last Updated: October 7, 2026
Establish a Waste Baseline and Measurement System
You can't improve what you don't measure. To reduce print waste in supply chain operations, start with a clear baseline of where waste occurs.
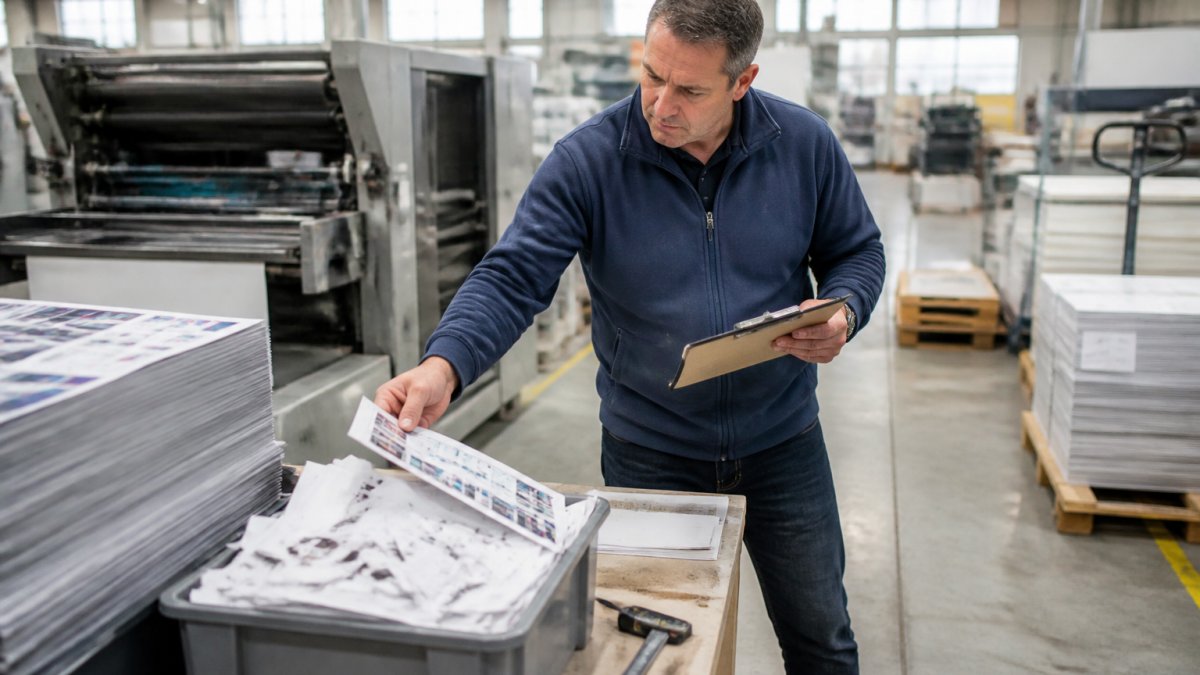
Most printing operations generate waste at multiple points: setup scrap, color test runs, failed jobs, damaged stock, and obsolete inventory. Track each separately.
Track scrap rates by job and material type
Document every print job: material type, quantity ordered, quantity delivered, and scrap generated.
Scrap rates vary by complexity: a simple one-color job on standard paper might generate 2-3% waste, while a multi-color job with tight registration can hit 5-8%.
Create a simple spreadsheet with these columns:
- Job ID and date
- Material type and weight
- Ordered quantity
Track for at least 30 days to see which jobs, materials, or lines generate the most waste.
Calculate material yield and waste per unit
Material yield is the percentage of material that becomes usable product: order 1,000 sheets, deliver 950, and your yield is 95%.
Calculate waste per unit by dividing total scrap weight by total units produced. A job wasting 10 pounds might cost $2, but across 100 jobs annually that's $200 in pure waste.
Once you have baseline data, set a realistic target. Many operations reduce scrap 15-20% within 90 days through better planning and quality control alone.
Improve Print Inventory Management Across Locations
Overstock is invisible waste: paper sitting in a warehouse for six months costs money in storage, handling, and eventual disposal.
For multi-location operations, inventory management is critical. One location ordering 5,000 brochures while another orders 3,000 of the same design is inefficiency built into your supply chain.
Implement demand forecasting to prevent overstock
Pull 12 months of order history and identify patterns by location, season, and product type.
Many retail chains see 40-60% higher demand in peak seasons; if forecasting ignores this, you'll overstock in slow periods or run short in busy ones.
Work with each location manager on quarterly forecasts: ask what they used last quarter, their expected growth rate, and any seasonal spikes.
Consolidate orders and reduce obsolescence
Consolidating orders from multiple locations into single production runs reduces setup waste and improves pricing: run one batch and distribute afterward instead of five separate jobs.
This also reduces obsolescence risk. Old inventory becomes waste when designs change or stock expires, so smaller, more frequent orders mean less sitting inventory.
Track obsolescence separately from production scrap. If a location ordered 2,000 items and used 1,200 before a design change, that 800-unit gap is obsolescence waste requiring different solutions.
Optimize Production Planning and Job Efficiency
Production efficiency directly impacts waste. A poorly planned print run generates more scrap than a well-organized one.
Batch similar jobs to reduce setup waste
Every press stop for a color change, material swap, or die adjustment loses time and generates setup scrap. Batching similar jobs minimizes these transitions.
Group jobs by:
- Ink color (run all black jobs together, then all four-color jobs)
- Material type (run all coated stock together, then uncoated)
- Size and finishing (batch jobs requiring the same trim and fold)
Fewer setups per day mean less test waste and faster throughput.
Improve color accuracy and proofing to prevent reprints
A reprint is the worst waste: you've already spent materials, labor, and time on a job that didn't meet spec.
Implement a formal proofing process:
- Print a sample before running the full job
- Compare the sample against the approved color standard
- Document the proof and approval in writing
Many reprints happen because color expectations weren't clear. A client expects Pantone 185 red but the job was printed in process red.
Adopt Print-on-Demand for Businesses to Lower Overproduction
Print-on-demand changes the economics of inventory: print 1,000 units and reorder as needed instead of 10,000 upfront.
Right-size order quantities with on-demand capabilities
Small businesses benefit most: a startup doesn't need 5,000 business cards, just 500 now and 500 in three months.
On-demand printing right-sizes orders to actual demand, reducing overstock and obsolescence so you only pay for what you use.
The trade-off is per-unit cost: a 10,000-unit run costs less per card than a 1,000-unit run, but if 8,000 cards sit in a warehouse, the savings disappear.
Reduce carrying costs and storage waste
Storage costs money, warehouse space, climate control, handling, and disposal add up, and for multi-location operations storage waste multiplies.
On-demand printing cuts these costs by eliminating bulk inventory and reducing damage, theft, or obsolescence risk while materials sit in storage.
American Printing Services, LLC helps businesses consolidate multiple vendors and manage inventory across locations efficiently.
Implement Sustainable Printing Practices in Your Supply Chain
Sustainability in print is a procurement decision across every tier of the supply chain, paper mills, ink formulators, converters, printers, fulfillment warehouses, and last-mile distributors. Most guides stop at "buy recycled paper," leaving the largest waste levers untouched, because buyer specifications, contracts, and reporting requirements are what move supplier behavior.
Treat sustainability as a supplier-management discipline, not a purchasing preference.
Write waste and material standards into procurement specs
A purchase order is the most powerful waste-reduction document in your supply chain. If the spec doesn't name a waste metric, the supplier has no obligation to improve it.
Build these clauses into every print and packaging contract:
- Substrate specification: name the recycled content percentage (for example, 30% post-consumer fiber minimum for coated stock, 100% for corrugated shippers), the certification body (FSC, SFI, or PEFC chain-of-custody), and the acceptable brightness and caliper range so substitutions do not quietly increase waste.
- Ink and coating chemistry: require low-VOC or soy/vegetable-based inks where the substrate allows, and specify whether the printer may substitute a petroleum-based equivalent without written approval.
- Overrun and underrun tolerance: define the acceptable delivery window (for example, +2%/-0% on a 10,000-unit run) so suppliers cannot bill you for overproduction that becomes your obsolete inventory.
Without these clauses, "sustainable supplier" is marketing; with them, it's an auditable commitment.
Build a supplier scorecard that weights waste, not just price
Price-only sourcing rewards suppliers who hide waste in unit cost. A weighted scorecard reverses that incentive.
A practical scorecard for print and packaging suppliers uses five categories:
| Category | Example weight | What you measure |
|---|---|---|
| Material yield | 25% | Usable units delivered ÷ material issued |
| Reprint rate | 20% | Jobs reprinted ÷ jobs produced |
| On-time, in-full delivery | 20% | Orders delivered complete and on schedule |
| Sustainability compliance | 20% | Certified fiber, low-VOC inks, documented diversion rate |
| Responsiveness | 15% | Time to resolve a defect or spec question |
Score each supplier quarterly and share the results. Suppliers who see their yield and reprint numbers next to a competitor's self-correct faster than any audit forces them to.
Require shared reporting and joint waste reviews
Waste that crosses a company boundary is invisible to both sides. The printer sees trim scrap; the brand sees obsolete inventory; neither sees the whole picture.
Close that gap with a shared reporting cadence:
- Monthly waste report from each print and packaging supplier, covering scrap pounds by category, reprint count, and diversion rate.
- Quarterly joint review where buyer and supplier walk through the top three waste drivers and agree on one corrective action each.
- Annual specification refresh where both sides revisit substrate, ink, and tolerance clauses against actual performance data.
This is the closed-loop discipline manufacturers use with tier-one automotive and electronics suppliers; print supply chains rarely apply it, which is why the waste persists.
Evaluate equipment and energy as part of the supplier decision
Equipment age and energy source are legitimate procurement criteria. When evaluating a print partner, ask for:
- The install year of each press and its energy rating.
- Whether the facility purchases renewable energy credits or has on-site generation.
- The facility's documented waste diversion rate and its recycling vendor.
A supplier with modern, well-maintained equipment and a documented diversion program typically produces less scrap per job than one running aging presses, a difference that shows up in your yield numbers.
Align sourcing decisions with demand signals
Procurement shouldn't order in a vacuum. Forecasting data should feed directly into supplier contracts as volume commitments with flexibility bands.
A common pattern is a rolling 12-month volume forecast with a ±15% quarterly flex band: the supplier plans capacity against the forecast, you commit to the band, and neither side is stuck with idle capacity or emergency surcharges.
FSC chain-of-custody certification requirements
EPA guidance on reducing commercial and industrial waste
Execute Quality Inspection and Defect Prevention
Quality defects drive reprints and waste; rigorous inspection catches problems before they become losses.
Use inline inspection to catch errors early
Inline inspection happens during production: a press operator or automated system checks samples at regular intervals and stops the job if quality drifts.
This catches color shifts, registration errors, and print defects immediately, stopping after 500 good and 50 bad units beats discovering the problem after 5,000.
Inline inspection requires clear quality standards. Define acceptable thresholds for:
- Color variation (use a spectrophotometer to measure Delta E)
- Registration tolerance (typically ±1/16 inch)
- Print density and ink coverage
Establish standards for acceptable quality thresholds
Every job needs a quality spec. What's acceptable for a promotional postcard differs from a critical business form.
Document these standards in writing:
- Acceptable color tolerance
- Maximum defect rate (e.g., 1 defect per 1,000 units)
- Registration tolerance
Share these specs with production teams and suppliers; clear standards reduce disputes and rework.
Create a Closed-Loop Recycling Program
Recycling bins are the visible end of a waste problem that starts at procurement. A true closed-loop program maps material flow from when fiber, ink, and packaging enter your supply chain to when they leave as product, scrap, or landfill.
Map material flow end to end before you optimize any single stage
Before adding a bin or signing a recycler, trace every material stream through five stages:
- Procurement, what fiber, ink, adhesive, film, and packaging enters the facility, in what quantity, and from whom.
- Production, what becomes finished product, what becomes setup scrap, what becomes production scrap, and what becomes reprint waste.
- Warehousing, what sits in inventory, for how long, and what becomes obsolete before it ships.
- Transport and distribution, what packaging, pallets, and dunnage move with the product, and what returns.
- End of life, what the customer does with the printed item, the shipper, and the insert after use.
At each stage, record material in, material out as product, and material out as waste. The gap is your true waste rate.
Separate the four waste streams and route each to the right channel
Not all print waste recycles the same way; treating it as one stream contaminates high-value material and sends the rest to landfill.
- Paper and corrugated: baled separately by grade (white office, mixed, OCC corrugated). Contamination with plastic film or adhesive is the most common reason a bale is rejected.
- Ink and toner: cartridges and bulk ink containers go to a certified refiller or recycler, not the paper stream. A single cartridge in a paper bale can downgrade the entire load.
- Plastic film, shrink wrap, and dunnage: routed to a film recycler; many municipal programs reject it, so a dedicated vendor is usually required.
Label each collection point with the specific downstream channel, not just the material name. "Paper" is ambiguous; "white office paper, baled for [recycler name]" is actionable.
Build a reverse-logistics loop for printed inventory and packaging
Closed loop means material comes back, not just leaves cleanly. Two reverse-logistics mechanisms matter most:
- Printed inventory take-back: when a design changes or a promotion ends, unsold brochures, catalogs, and packaging are collected from locations and routed to a pulper or recycler rather than a dumpster. This converts obsolescence waste into recovered fiber.
- Reusable transport packaging: replace single-use corrugated shippers with reusable plastic totes or pallets on closed distribution routes. The break-even is typically reached after a modest number of trips, after which every additional trip is pure savings in material and disposal cost.
Both require a return path in your distribution network. If outbound trucks run empty on the return leg, that's free reverse-logistics capacity you're wasting.
Track diversion and yield metrics, not just pounds recycled
Pounds recycled is a vanity metric. The metrics that drive decisions are:
- Diversion rate: material diverted from landfill ÷ total waste generated, by stream.
- Recycling yield: material actually reprocessed ÷ material collected. A high collection rate with a low yield means contamination is sending your bales to landfill anyway.
- Cost per ton diverted: total program cost (labor, bins, hauling) ÷ tons diverted. This tells you whether the program pays for itself or is a compliance expense.
Review these monthly alongside production scrap and reprint metrics. When diversion stalls, the cause is usually contamination or a missing channel for one stream, not a lack of bins.
Close the loop back into procurement
The final step most programs skip: feed recovered-material data back into purchasing. If your program generates steady recovered fiber, ask whether your paper supplier can incorporate it into your next order, or whether a certified recycler can supply post-consumer content directly.
EPA Waste Reduction Model (WARM) for calculating diversion impact
Sustainable Packaging Coalition guidance on material recovery
Frequently Asked Questions
How can businesses reduce waste in printing?
Start by measuring your current waste baseline using scrap rate and material yield metrics. Then implement demand forecasting to prevent overstock, optimize job batching to reduce setup waste, improve color proofing to avoid reprints, and establish quality inspection standards. Consider print-on-demand for variable materials, select suppliers using energy-efficient equipment, and create a closed-loop recycling program for ink, toner, and paper. These steps address production efficiency, material selection, and end-of-life waste simultaneously.
How can print inventory management reduce excess materials?
Implement demand forecasting to align print quantities with actual consumption across your locations. Consolidate orders to improve material yield and reduce handling waste. Track inventory levels in real time to prevent obsolescence and overstock. For multi-location operations, centralize procurement to avoid duplicate orders and storage waste. Print-on-demand capabilities allow you to produce smaller batches more frequently, cutting inventory holding costs and reducing the risk of printed materials becoming outdated or damaged.
What should businesses look for in a sustainable printing supplier?
Select suppliers that use energy-efficient production equipment, offer recycled and sustainably sourced substrates, and provide closed-loop recycling programs for production waste. Ask about their baseline waste metrics, quality inspection processes, and ability to batch jobs efficiently. Verify they can deliver consistent color accuracy across batches to minimize reprints. For multi-location needs, choose a partner with a network capable of handling consolidated orders and reliable delivery, reducing the environmental impact of fragmented supply chains.
How can better forecasting reduce excess printed materials?
Accurate demand forecasting prevents overproduction, which is a major source of waste in print supply chains. By analyzing historical consumption patterns and seasonal trends across your locations, you can order quantities that match actual need rather than inflated safety stock. This reduces material waste, storage costs, and the risk of obsolescence. Coordinate forecasts across all locations to consolidate orders, improving production efficiency and material yield. Suppliers with transparent production planning can help you optimize order timing and batch similar jobs together, further reducing waste per unit.